Overview
The story of 2Q is low volatility. The market has stayed locked in a historically narrow range with little direction to speak of. The market is at new highs, and there are at least a few signs of secular excess in some indicators that are of concern. The lack of volatility and overbought nature of the market certainly holds the possibility for renewed downside volatility this year. That said, we want to be clear: our longer term outlook remains to favor continued improvement in the equity market. Monetary Policy is still accommodative, the Economy is doing well enough to continue its expansion, and the Trend of the market is still positive. Valuations are average, if not a little pricey. The market being “a little pricey” in and of itself means very little. We have said many times that you cannot use valuation as a measure of when the market may bottom or top. The market can be cheap and get much cheaper than you think (2008), and it can remain expensive and continue going higher for an extended time (1998 – 2001). We still believe we are in the 6-7th inning of this bull market. The Fed will likely tighten this year, and while that holds the possibility for volatility, more often than not, the equity market continues to rally (albeit with more volatility) when the Fed starts tightening.
While the market as a whole has been somewhat quiet, underneath the surface there has been considerable volatility in different equity sectors: After 5 years of suffering poor relative returns, International finally started outperforming in the first quarter of this year. But over the last few weeks, this outperformance has been waning. So much so, that the German market has now pulled back over 10% from its latest high! Small and Mid Cap have outperformed this year, a change from last year’s spotty performance in Small Cap. The bond market has done poorly as interest rates have started moving higher in response to a firming economy here, and especially overseas. We are also seeing signs of deflation possibly loosening the grip it has had on the world economy for the last 8 years.
The Economy
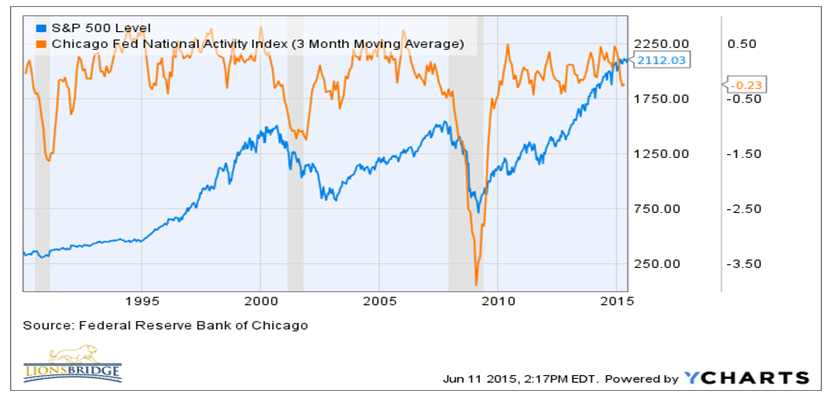
After a concerning 1Q slowdown, we are finally seeing signs of improvement in the economy, as we expected. The effects from the port closures and cold weather have abated and conditions, while still sluggish, are showing signs of improvement. Significantly, we are seeing signs of deflation perhaps not being as much as a force as it has been over the last decade of so. Wage inflation, while still low, is showing signs of firming as the jobs market continues to improve. The CFNAI (a comprehensive measure of economic strength amongst a number of indicators) is still measuring the economy as “good enough”, as it is unchanged at around -0.2% over the last 3 months. As long as this broad measure of the economy is above -0.7% or so, historically the economy has been strong enough to keep the equity market afloat. This chart illustrates this.
Fed Policy
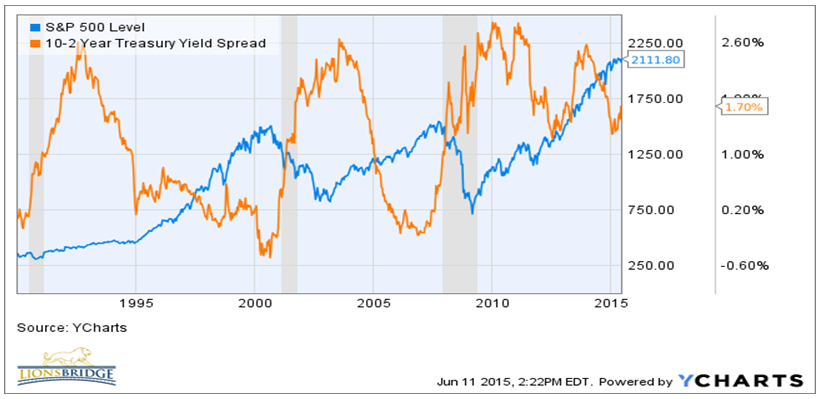
All of these factors are putting pressure on the Fed to tighten at some point this year. To be sure, there is still slack in the system, and it is this long term structural disinflation that has kept the Fed on the sidelines. But the odds continue to build for a hike in rates to start this year. That said, the best measure of whether Fed policy may likely affect the economy is the shape of the yield curve. If it gets too flat or inverts, trouble may be coming. Happily, this is not the case. The Fed has done an exceptional job of telegraphing their thoughts, and even if they start tightening, it will likely be in very small steps. As such, the yield curve is still positive enough to likely keep us out of trouble, economically. The chart below demonstrates this:
Valuation
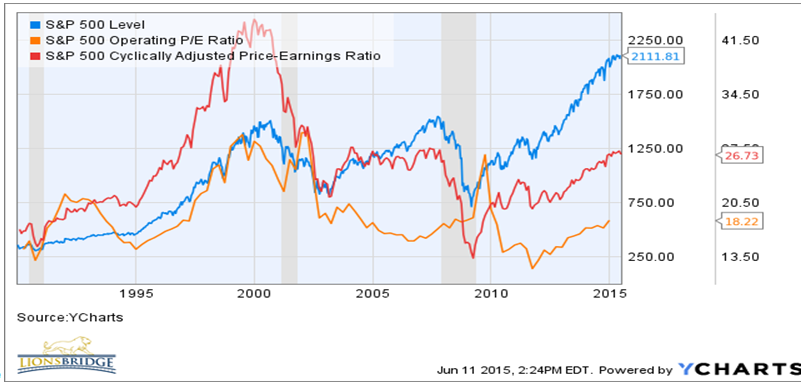
P/E ratio’s are elevated but not extended. Depending on how you measure and smooth earnings, it is clear that the market is no longer cheap, and the Cyclically Adjusted P/E ratio is a little rich. All measures of market valuation have their limitations, and none have a good track record of predicting market highs or lows. We look at many measures of valuation, and there are some very long term data series from the Federal Reserve that have several months of data delays, but they also show that equities as a percentage of GDP or Assets are fairly high. Again, none can be used to call a top, but are useful reminders that going forward volatility will be more important than it has been in the past few years.
Equity and Bond Strategy
Our Long Term Equity Strategy of stocks that we own for generally long term capital gain treatment with strong measures of Value, Growth, and Quality is performing well. We just recently added to our energy exposure from a large underweight last year as we view the damage here largely behind us. We continue to be over-weighted in Finance, Industrials and Technology, areas that should do well as the economy improves.
The Tactical Equity Sector ETF Strategy has been a market performer this year, as we have seen quite a bit of volatility and longer term trend changes so far this year. Last year was a stellar year for this approach as it guided us away from dramatic underperformance in International and Small Cap. The trends in many areas are in the process of potential change and are showing great volatility, but once the trends solidify, this strategy will guide us in the right direction.
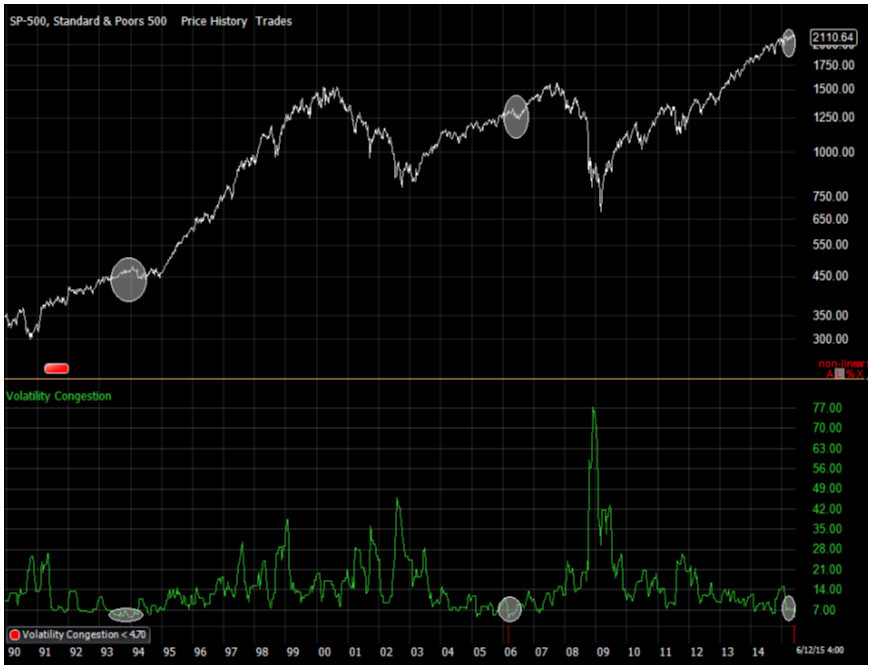
Our Long/Short hedging strategy has been an area of weakness so far this year. As we mentioned earlier, volatility has been historically low. Since the market made a new high in mid February, the market has stayed in a very tight range. The chart below shows that this range is as small as it has ever been only two other times since 1990. This extremely tight range makes it nearly impossible for the hedging strategy to find downtrends to hedge. As we all know and as the chart shows, volatility doesn’t stay low forever! It is sure to pick up and in doing so it will likely be a useful strategy in our portfolio. Until then, as long as this tight range stays in effect, returns for Long/Short will be unimpressive. It is interesting to note that after both times that volatility got this low, (early 1994 and early 2006), the market ended up correcting 8-9%, and then went higher. We are not making a prediction on such a small data set, but it certainly wouldn’t surprise us.
 Our Fixed Income portfolios remain high in quality and short in duration. This is a good thing, as rates have finally started to move higher. Bond investors looking for yield in longer term bonds are getting stung by declining prices. We still believe that investors are underestimating how much higher rates can go, and we will maintain our conservative stance until we see signs of economic softness along with fear in the bond market, neither of which we see currently.