Overview- 2025 has been an exciting year between war, tariffs, inflation, and so on. Regardless of the volatility, the market hasn’t moved too much since last year, so we have reserved judgement until things are a bit clearer. Our expectation is that, barring any further surprises, there is potential for the market to move higher by year end; some details are below.
From the ashes of a -57% decline in 2008 / 2009, the current secular current bull market was born. In the first decade after that low, we experienced four declines of around -15%: 2010, 2011, 2016, 2019. Since then, volatility has expanded both to the upside and downside, with declines of -34% in 2020 and -25% in 2022, the former ending in record time (23 trading days) and the latter lasting most of the calendar year 2022, a much longer drawn-out affair.
During 2Q of this year we experienced the seventh pullback during the secular bull market. The market declined -19% in 34 days, the majority of which occurred in 10 days as fears of a tariff war erupted. One of the most important actions we take is to be defensive during difficult market conditions. One of the primary indicators we utilize to move the portfolio to a more defensive posture is when the S&P 500 index closes below its 200-day moving average (Exhibit A). This occurred during March of this year. However, much like the Covid decline in 2020, it ended almost as quickly as it started. The market clawed back 2/3 of the decline in about a month and subsequently rallied to new highs. YTD domestic stock indices are mixed with Small-Cap S&P 600 down –4.5% while the Large Cap S&P 500 is up around 5.5%. The market is still leaning towards growth and away from value and smaller companies. After years of underperformance, international indices are outperforming but are still long-term laggards, and it remains to be seen how they fare going forward.
Trading Discussion- Going into the beginning of the year, we were expecting a sideways market as valuations and sentiment seemed a little overdone to the upside, but fundamentals were solid. We expected a trading range market with little upside or downside. We favored writing calls against market-oriented indices to earn income as the market traded sideways. As the tariff news hit the market, we reduced beta in the portfolio by selling a few higher beta holdings and holding cash. We did not adopt an overly bearish position by shorting the market, as we viewed the pullback to be too far and too quick – sentiment was as negative this year as it was at the bottom of the Great Financial Crisis (GFC) in 2009. The oversold sentiment suggested the potential that the sell-off was an “over-reaction,” and after the market bottomed out, we measured what is typically known as a significant breadth expansion, meaning significant buying pressure was building. When the market is as oversold as our sentiment measures indicated, and the subsequent breadth expansions occur, strong market rallies typically occur.
As the market showed signs of a solid bottom, we moved the portfolio to a fully invested approach by putting our cash to work in higher beta sectors of the market, favoring growth and momentum factors. We also added additional exposure to the AI theme by investing in semiconductors, data centers, power generation, Bitcoin, and Bitcoin mining. It’s important to note that we are doing this in a very diversified manner, and we do not have the same extreme market concentrations in individual names and technology as the broad indices (Exhibit B).
Outlook- Even though the economy is slowing, earnings are still moving higher, and analyst revisions are improving. This is the fundamental pillar that is supportive of the market. While there were short-term concerns earlier this year with the new tariff policy, the market is comfortable that earnings will not be significantly impacted. Further, there is a growing consensus that the Fed is getting closer to easing rates, which should give the market confidence in all but the bleakest economic environments.
While the sentiment measures are no longer oversold, there are still signs that buyers need to come into the market. Global money supply and liquidity are moving higher, and this is supportive of asset prices. This liquidity, which has become a significant force in the market, should move the market higher over the remainder of this year. If sentiment becomes too overbought, or the economy slows enough for analysts to revise earnings lower (that briefly occurred this year with the new tariffs), then the market may run into trouble. However, the Fed has started to signal that they would be supportive should the economy falter. This is likely to happen sooner, than later, if a more dovish Fed Chair were to replace the current Fed Chair – Jay Powell.
The one clear negative is the same negative we had at the beginning of the year – that valuations are exceedingly high and from a bigger picture perspective, more indicative of the end of a secular bull market rather than the beginning. Valuations are, as we had said many times, a poor timing indicator. It is likely that future returns may well be challenging, but that is more likely if we enter a recession and/or the Fed is forced to raise interest rates, neither of which seem to be in the cards in the near term.
Conclusion- Our general view is that the market is in an acceptable position for the balance of the year as the next Fed move will likely be an ease and the economy and earnings are “good enough”. Given how much the market has moved in the short term, there is certainly the possibility of a 5-10% correction over the next 3 months, but as long as sentiment does not get too overbought and there are no negative surprises in inflation or tariff negotiations, the market should be in good shape. We are still concerned about the longer term as valuations are poor, but for now, that appears more likely to be an issue further down the road.
Exhibit A-
In our view, the market generally becomes “oversold” when it moves below the 200 Day Moving Average (200MA). Why do we bother with mitigating risk and reducing beta when the market starts to struggle? The chart below shows why we take action in such a circumstance. The red line is the return on the S&P 500 since the late 50’s when it is below the 200MA. When the market is below the 200MA, returns are lackluster with many significant drawdowns (1968, 1974, 1987, 2000, 2008, and if you squint in 2022).
There is a cost to getting defensive, and it can be measured by the green line – waiting for the market to rise above the 200MA underperforms the S&P 500 (blue line). But it does provide a smoother ride by avoiding devastating bear markets. This is particularly important currently as valuations are at extended levels and we should be on the “watch” for the end of the current secular bull. The small performance sacrifice we make for being conservative below the 200MA is worth the defense that will be important to have in the next secular bear market.
From a trend following perspective, it’s better to buy when the market is trending up – above its 200MA – than when the market is trending down – below the 200MA. There is nothing “special” about the 200MA, the same result is for almost any longer-term MA.
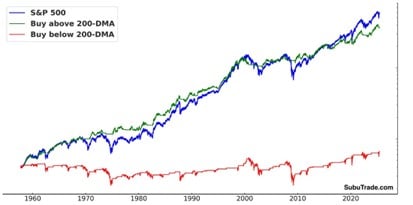
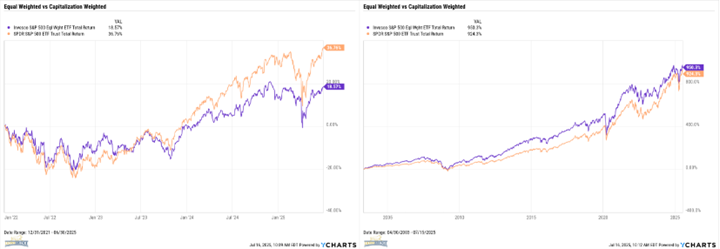
Exhibit B-
We are far more diversified than the S&P 500. The S&P 500 is about as concentrated as it ever has been and was even worse at the end of last year. The current capitalization weighted S&P 500 has 32% of the Index in only seven technology stocks and 8% in a single company – NVDA. This is a very aggressive risk posture. We typically start with 1%-2% position per name and rarely let that get higher than 5-6% and never have significant sector concentrations nor high exposures to a small number of names. We track closer to the equal weighted approach to the S&P 500 where we have a large degree of diversification, and as it follows, safety.
The equal weight index (purple line) has certainly underperformed since 2022 (left graph), and cap weight has been the way to go with perfect foresight. However, over the long term (right graph), equal weight outperforms cap weighted. They go through cycles and from time to time they catch up with each other, but the equal weight index has a long-term advantage and is safer! We don’t know if we are at the top of a technology bubble, like the Dot Com bubble of 2000, but the below graphs outline why we aren’t going to reduce diversification and take on extreme concentrations in individual names and sectors like the cap weighted S&P 500 has. If it turns out that we are at the top of a tech bubble (seems very possible), equal weight will dramatically outperform. At the very least, if there is some mean reversion, there is a decent chance that the market broadens out and participation becomes more even throughout the market.
It is for these reasons that we are very comfortable sticking with a more equal weight approach rather than a cap weighted approach.