Is the Stock Market overvalued?
We are going to try to answer this age-old question, but before we do, we want to remind you what we think of valuing the markets. Valuation should never be used to judge if the market should be bought or sold. Valuation is a way to measure the potential for future long-term returns, especially when determining if the market is overbought.
The economist John Maynard Keynes said, “markets can remain irrational longer than you can remain solvent.” A hallmark of bull markets is they get overvalued and stay that way for some time. For example, in 1996, Fed Chairman Alan Greenspan said that the equity market was “irrationally exuberant”; 4 years before the 2000 dot-com top.
Price-to-Sales Multiples
Speaking of the 2000 dot-com top, below is a quote from Scott McNeely (in italics), the CEO of Sun Microsystems in 2002 after the dotcom bust. Sun Micro was a very well-run company and McNeely was one of the brighter CEOs in his day.
Q: Sun’s stock hit a high of $64 (in 2000). Did you think how tech stocks were priced at that time was too good to be true?
A: Two years ago, we were selling at 10 times revenues when we were at $64. At 10 times revenues, to give you a 10-year payback, I have to pay you 100% of revenues for 10 straight years in dividends, assuming I can get that by my shareholders, it also assumes that I have zero cost of goods sold, and zero expenses, which is really hard with 39,000 employees. It also assumes that we pay no taxes, which is extremely hard, as well as paying no taxes on your dividends, which is illegal. On top of all that it also assumes zero R&D for the next 10 years. If I can avoid all of that and keep the current revenue run rate, then all is good. Now, having done that, would any of you like to buy my stock at $64?
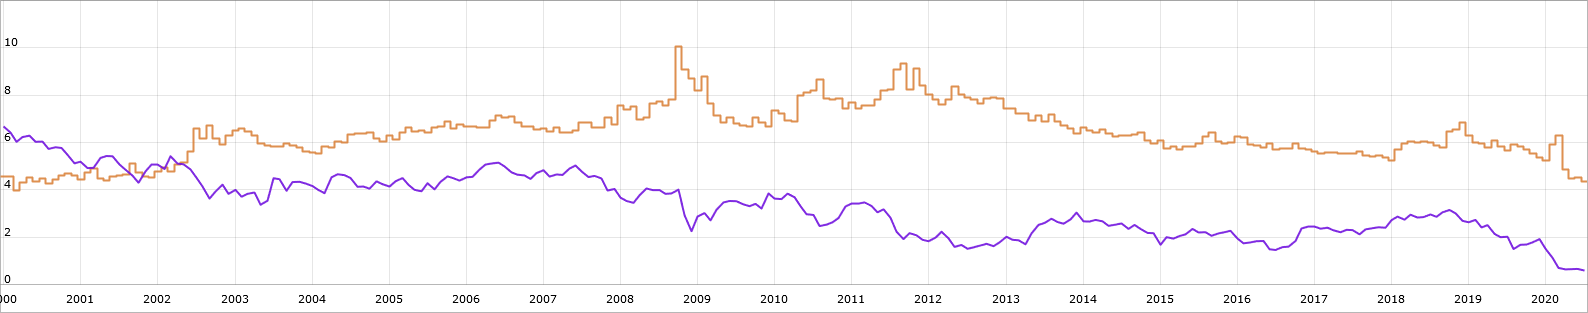
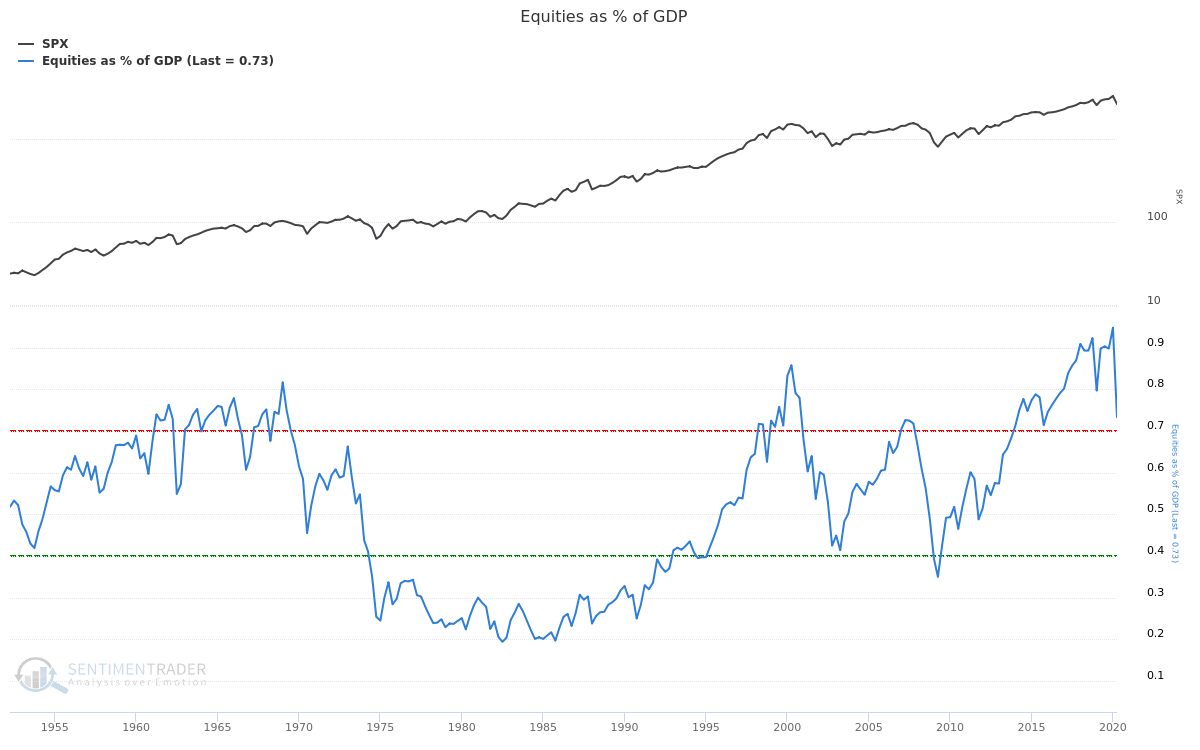
Do you realize how ridiculous those basic assumptions are? You don’t need any transparency. You do not need any footnotes. What were you thinking? I was thinking it was at $64, what do I do? I’m here to stand for the shareholders. Do I stand up and say, “Sell”? I’d get sued if I said that. Do I stand up and say, “Buy”? Then they say you are Companies that are experiencing high sales growth but where earnings are low, or negative, are often valued based on Sales rather than Earnings. This concept asks for a large leap of faith that the company will eventually become profitable. The upside is that Sales cannot be “managed” with accounting tricks like earnings, so it is a useful guide, if somewhat hopeful. Traditionally, companies are judged to be a good value at 1-2 times Sales. But companies that are growing sales faster or have higher gross margins (suggesting higher net margins down the road are possible) should sell for a higher multiple, so there is some judgement involved as to when a company is overvalued based on Sales. That said, it is fair to say that Mr. McNeely thought that 10 times sales was overvalued for his company. We conducted a study and broke down the S&P 500 and Nasdaq 100 indices into quintiles based on their Price-To-Sales valuation. Below are our findings: SP500 Nasdaq100 1st 9.3 15.5 2nd 4.1 9.2 3rd 2.2 5.4 4th 1.3 3.3 5th 0.5 1.1 Source:Portfolio123 At 9.3 times Sales, the top quintile of the S&P 500 is close to the level (10X) that Mr.McNeely of SunMicro thought that his company was overvalued and, in retrospect, signaled a top in the market in 2000. The top quintile of the Nasdaq 100, at 15.5 times Sales, is currently 50% more overvalued than the top in 2000. However, only the top quintile of stocks sorted by P/S ratio looks significantly overvalued (by this measure). The second quintile of the S&P 500 sells for 4X, which certainly is not cheap, but we would judge as “fair”. And the rest of the S&P 500 is very reasonably valued. Using P/S ratios, the overall market is not terribly overvalued, but you could argue that there is a part of the market that is significantly overvalued. Price-to-Earnings, Interest Rates, and the Fed Model The chart below is a more straightforward measure that we all are acquainted with – the Price-to-Earnings ratio or P/E ratio. Currently, the forward P/E (the “E” is based on forward estimates for earnings, not trailing earnings) is at 21.5, close to the high in 2000 at 24. Source:Charles Schwab By this measure we are clearly in overvalued territory. But in our view, there is a catch – and that catch is interest rates. The Fed thinks that in response to the economic fallout from the Coronavirus, that the best policy to achieve its dual mandate of full employment and 2% inflation was to lower Fed Funds to 0%, give forward guidance that they will likely keep rates low for an extended period (1-2 years?) and expand their balance sheet by several Trillions $’s in an effort to keep rates low. Should that effect valuations? Yes. Any financial analyst will tell you that the present value of any financial or even real asset must be discounted by interest rates, and this will affect valuations. There are two ways we can measure this effect of lower interest rates on valuation. The first is we can look at historical P/E ratios at various levels of interest rates. It should not be surprising that higher interest rates result in lower P/E ratios. Higher interest rates are terrible environments for financial assets – think of the inflationary 1970’s. However, lower interest rates are great for financial instruments and the last 10 years are a testament to this notion. Below is a linear regression analysis of what level of P/E ratios were associated for a given level of interest rates, historically. Here we are using trailing P/E ratios, so the numbers are a little different than the above graph. Higher rates were associated with lower P/E’s and vice versa. You can argue that the case for rates between 0% and 1% (where we are now) could support a P/E ratio of 30 for the market. That said, this analysis is just a naive linear regression of the two variables. There is no iron clad rule here. All it says is that on a theoretical level forward P/E levels are certainly historically high, but lower interest rates help support where they are. The real risk is if rates go up! Source: Multiple Another way to look at this relationship is to compare the earnings yield of the market to 10 Yr Treasury rates. The yellow line in the graph on the next page is the historical earnings yield, which is just the reciprocal of the P/E ratio. Right now, the P/E ratio is 21.5 (we are using forward earnings again here), which is an Earnings Yield of 4.6%. This is significantly above the 10 Yr Treasury at 0.6%. You can see that by this measure, the market was far more overvalued in 2000, when the earnings yield was close to 4% and the 10 Yr Treasury was yielding over 6%. The problem with valuing the market relative to rates like either of these models do, is that when you go into a recession, it does not matter how cheap the market is. This was the case in 2008. The market was cheap compared to interest rates, and it did not matter. One of the worst bear markets of all time ensued because earnings dropped like a rock! Source:Portfolio 123 Equities as a % of GDP This is Warren Buffets favorite long-term valuation indicator. It simply looks at the capitalization of the market compared to GDP. Historically, when this indicator got above 70%, the market had a tough time going forward. Sometimes it was quickly like in 2007 and the market topped within a year, and in 1998, it took 2 years. But in the 60’s it took many years of lackluster returns and little upside that ended in 74 with one of the worst bear markets in history. By this measure, the market is as overvalued as it ever has been, and it suggests that future returns will be lackluster. In Conclusion It should be clear now that valuation is in the eye of the beholder! There are many ways to look at the market’s valuation, and they all tell a slightly different story, but the bulk of the evidence does suggest a few things to us: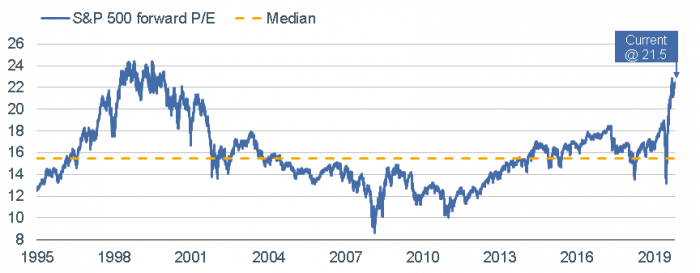
10 Yr Tsy
P/E
10.0%
12.3
8.0%
16.0
6.0%
19.8
5.0%
21.7
4.0%
23.5
3.0%
25.4
2.0%
27.3
1.0%
29.1
0.0%
31.0
-1.0%
32.9
Leave A Comment