Since early 2012 our views for the equity market and US economy have been largely positive. Our economic outlook has consistently been that while the recovery has been underwhelming, it has been “good enough”. We have highlighted that the Fed has been our friend with a very accommodative monetary policy. Additionally, after the bear market of 2008 and the pullbacks in 2010 and 2011, valuations were reasonable if not attractive and many investors remained underinvested and were negative on the markets. From a Technical perspective, we have also pointed out that the long term trend of the equity market has been generally positive while most secondary measures of market health have also been constructive. All of these factors have resulted in a wonderful market environment for the last 4 years, especially if you avoided the international markets, which we have.
Looking forward, it’s likely that many of these positive tailwinds are behind us and we now find ourselves potentially entering a different market environment. The economy, while still OK, is showing some cracks. The Fed recently tightened for the first time in over ten years. Valuations, while not extended, are not as attractive as they once were and investors are no longer underinvested. From a technical perspective, the long term trend may be faltering and there are signs of secondary technical weakness. These combined changes suggest a more cautious outlook on our part.
However, we do not believe that it’s time to run for the exits, rather, it likely means we will have some rough sledding over the next couple of years with more volatility. Once this cycle is complete, the bull market, which started in March of 2009, could continue to extend given the right circumstances. Of course, we would be foolish to not consider a more bearish outcome, but at the moment we don’t have the necessary ingredients.
Since we cannot predict the future, we employ two distinct components in our equity process. A Long Term Strategy based on selecting superior stocks that typically do well in bull markets and a Tactical Strategy which has more defensive characteristics and typically better relative returns in a bear market. Either way, we have strategies in place for however the market eventually evolves.
Our measured outlook should not change anything for our clients: we have Strategies for both bullish and bearish outcomes. The asset allocation we utilize for each client is long term in nature balanced with return objectives and risk tolerance, not by what we think may occur over the next year or two. However, it is a reminder for all of us to step back and review your current asset allocation as market volatility can invite short term decisions that often have a poor impact on long term results.
While our longer term outlook is still constructive, we expect the near term could be a little uncertain. Our Equity returns have exceeded the long term averages over the past 4 years and we believe the next few years are unlikely to match these results. Whether the next few years result in a benign but less rewarding environment (our expectation), or a market that involves some sort of a bear market is only a guess. Over the long term we are firm believers that our Strategies combined with the right allocation for your personal objectives will deliver solid results.
The Economy
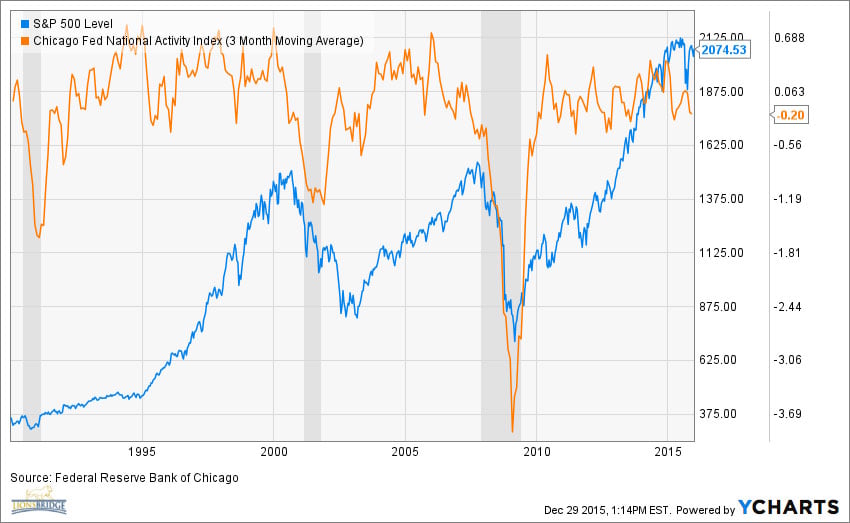
Our favorite measure of the economy, the CFNAI, shows that the economy is growing about -0.2% less than the long term trend. As we have stated numerous times, this level of growth is “good enough”. We typically don’t have trouble in the equity market until growth is significantly below trend (below -0.7%) which is much lower than where we are now. To be clear, this is not a leading indicator; by the time we reach these levels the equity market is usually already in a significant decline. However, it is an excellent confirmation of additional trouble if we do get down to those levels in the future.
Fed Policy
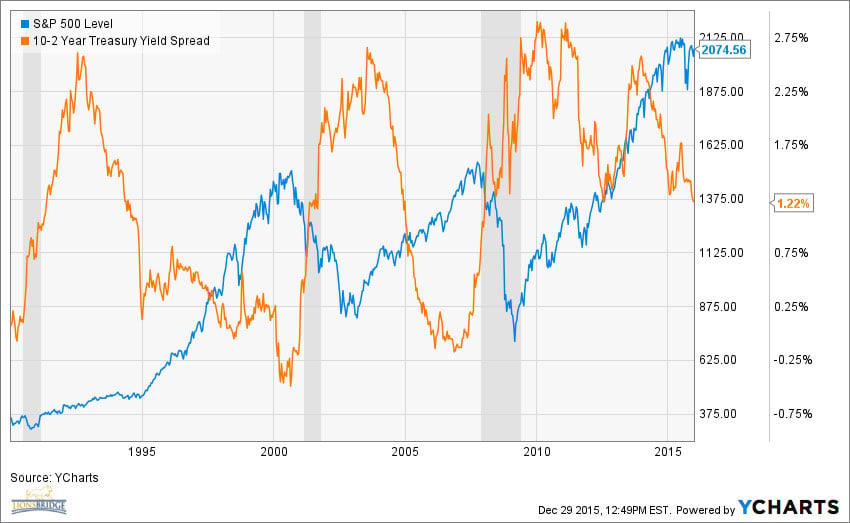
The yield curve spread ratio (the difference between 10 year and 2 year Treasury notes) is one of the best measures of Fed policy (chart below on next page). It has narrowed from a high earlier in the cycle in 2012 of around 3% (very accommodative) to a little over 1% now. Historically, the yield curve doesn’t warn of excessive Fed tightening until the ratio gets close to 0%, so by that measure we are still “OK”. However, a flattening curve suggests that the Fed is not nearly as accommodative as it was earlier in the cycle. As we highlighted earlier, easy monetary policies have helped fuel the market run, but it’s not likely to be a as supportive of a factor over the next few years.
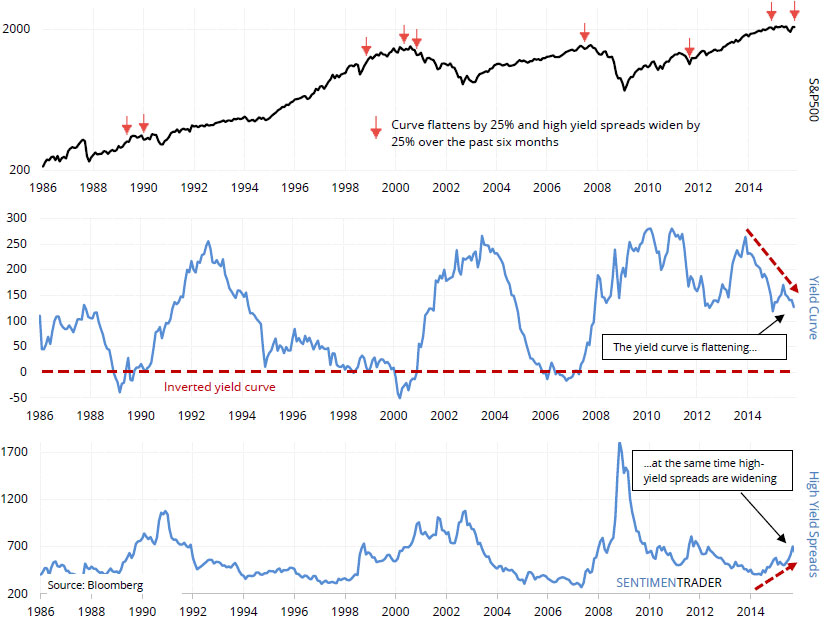
Another measure of economic strength is the spread between high yield bonds and Treasuries. As high yield bond spreads widen, it is thought of as a harbinger of more difficult economic times. This has been the case recently. The chart below (Source: SentimenTrader) annotates when high yield bond spreads are widening while the yield curve flattens. Typically, the result is either a choppy range or a pullback of some magnitude. A current concern with a less accommodative stance by the Fed is that the global economy is somewhat soft and higher US rates and a stronger dollar could weigh on the global economy. We are not fans of “this time it is different”, but the widening in junk bond spreads, while a concern, is as much a function of the weak energy market as it is overall economic weakness. Furthermore, while the Fed isn’t as accommodative as it once was, it’s difficult to envision a flatter yield curve with a Fed policy that is overly restrictive, as they are well aware of the delicate balancing act of moving the economy forward.
Valuation
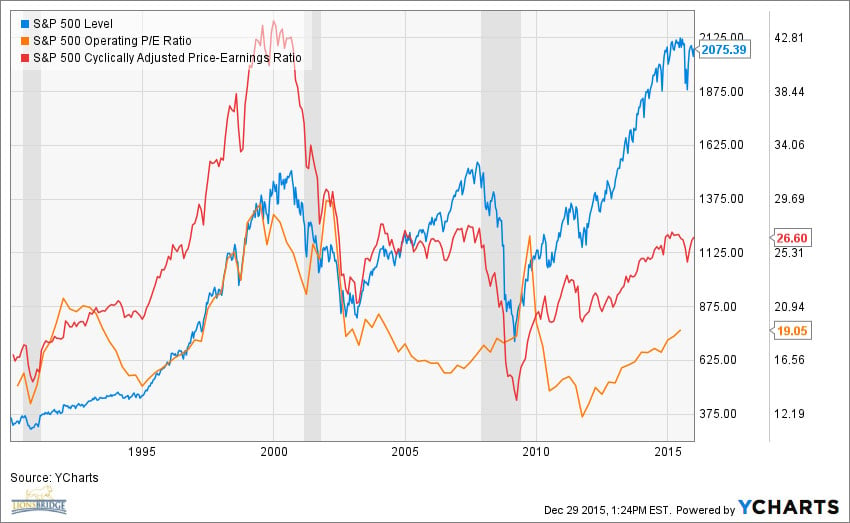
As we have stated frequently in the past, there is no magic measure of valuation that will signal that the market is expensive and should go down. The market often continues rallying once it is overvalued and there are many ways to measure valuation, all of which have their strengths and weaknesses. As we start 2016 the cyclically adjusted S&P 500 P/E ratio has gone from 14 (2009) to 27 and the Operating P/E from 12 to 19. All this tells us is that the market is not nearly as inexpensive as it was when the bull market began back in 2009. It should also be obvious that the potential returns going forward are not as attractive as they once were, but that tells us very little as to when and at what level of richness the market will eventually peak.
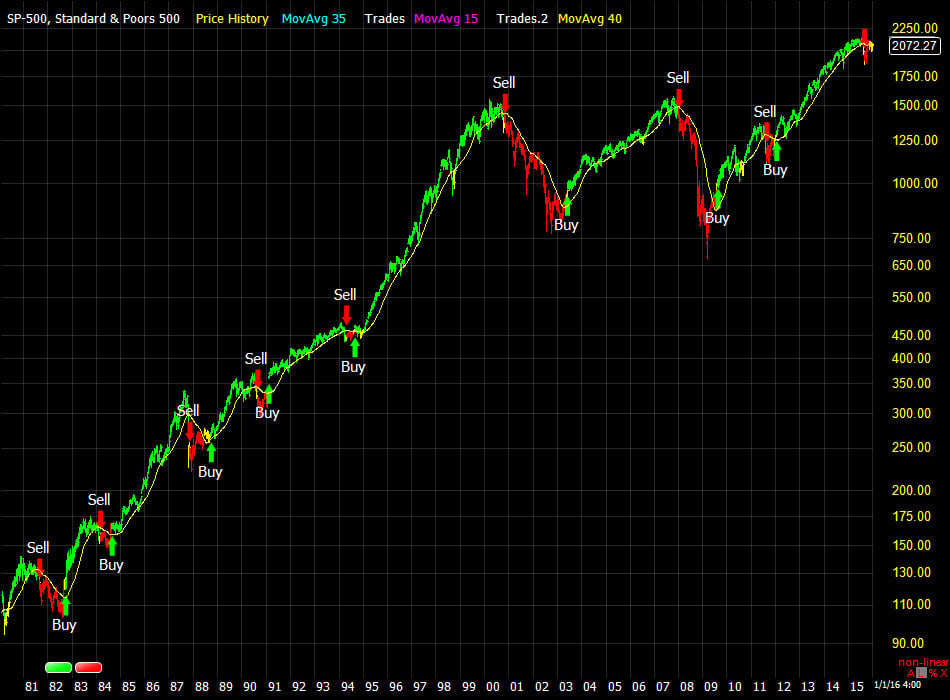
Long Term Trend
One of the most important disciplines we follow is that of the long term trend of the market. While it is not the Holy Grail it is the most important part of our discipline. Right now the long term trend, after turning negative in the decline that occurred during August and September, is neutral. The models we use to monitor the intermediate and short term trends are mixed as well, so technically there is not a clear picture. While this is not immediately bearish, it is concerning and we will be watching carefully as shorter term trends and market fundamentals evolve over the coming year.
Market Breadth and Volatility
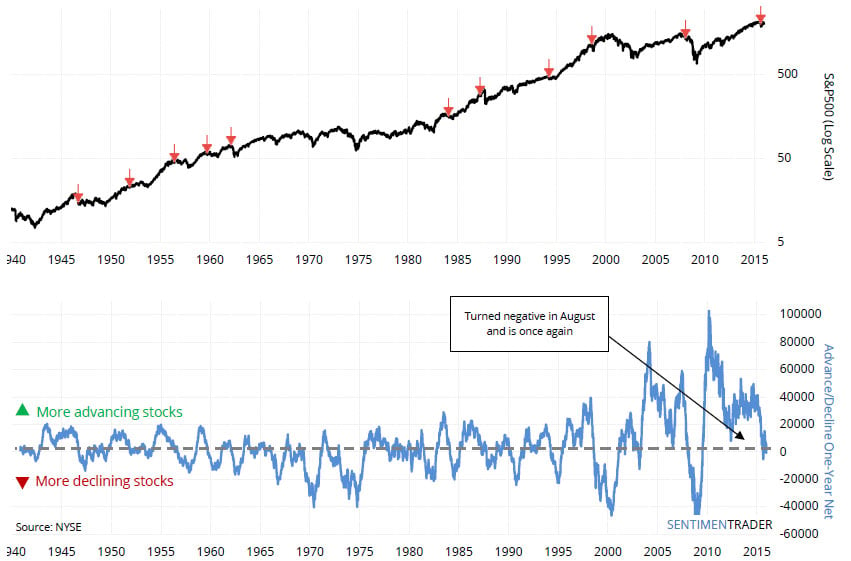
While we usually confine our Market Outlooks to discussions of the Economy, Monetary Policy, Valuation, Technical Trends and Sentiment, we also study numerous secondary indicators, most of which are not usually worthy of mention, however, we are making an exception as some of these factors are now catching our attention. Recent market breadth has been disappointing. There are numerous measures of market breadth (how broadly the individual components of the market are participating in a rally). Over the last year, the number of advancing stocks vs. declining stocks has turned negative. This factor usually suggests the potential for less than average returns.
You can see that in the chart below (Source: SentimentTrader) this often occurs near secular peaks or at least pauses in the market. Mean and median returns (2-7%) over the next year are much less than the average equity returns of 9%. Of course, this is not an automatic doomsday prediction as 4 of the 10 times this occurred the market was up over 10%. At worse, it is a reminder that the possibility for at least choppy activity is higher than normal.
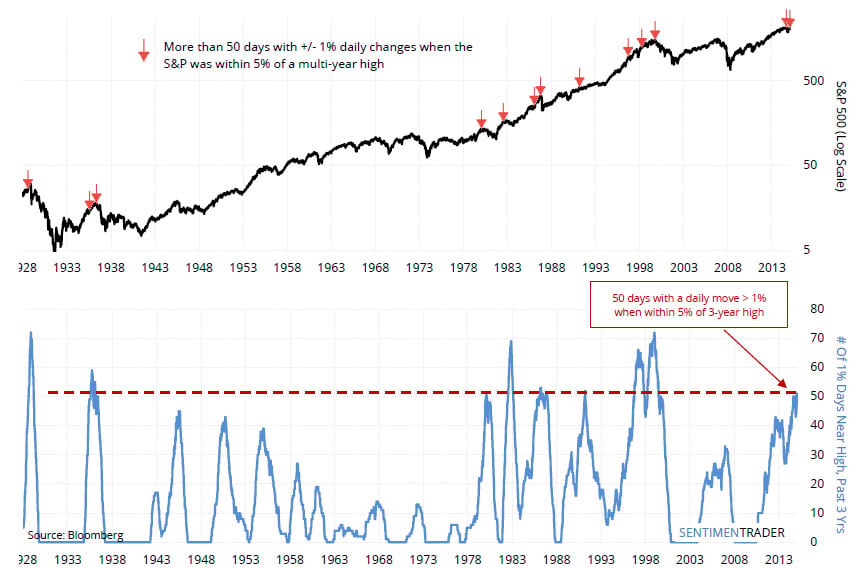
Another factor that has our attention is market volatility. We highlighted numerous times throughout 2015 that the market’s character was changing. Early in the year, the market stayed within a very narrow, yet very choppy range. Later in the year volatility increased dramatically as the market declined 10% – 15% then retraced much of that decline in short order. The chart below measures how many days over the past 3 years there has been a daily move of 1% or more while the market was near a high. We have now had about 50 days by this measure and this often occurs near peaks or at least pauses in the market. Subsequent 1 year returns were very poor: averaging around -5%, so this is quite concerning. Like the breadth study, it’s not imperative that the market must decline, as 3 of the 9 times this occurred since 1980 the market was able to muster a rally, but typically, rising volatility is not a sign of a healthy market.
Equity and Bond Strategy
Our Long Term Equity Strategy did well last year as returns for this strategy have exceeded its benchmark, the S&P 500. It’s important to note that while the S&P 500 was up 1.4% for the year, the equal weighted version – which represents the average stock in the S&P 500 – is -2.7%% so these results are especially impressive.
The Tactical Strategy, while slightly negative on the year, also served its purpose. At the lows of the market last year, the Tactical returns were solidly ahead of the benchmarks, which was a result of the Tactical Strategy’s defense kicking in, which is exactly what we want.
Our Fixed Income portfolios remain high in quality and short in duration. Our models have successfully steered us away from international and high yield bonds where total returns for last year were negative. The Fed has now tightened and may be poised to tighten further. Often this is an environment that calls for shorter average maturities, which is how we are currently positioned. However, we are vigilant should lower bond yields result if the economy starts to sputter and the Fed is forced back to the sidelines.